

Volatility is Elevated for Alts, but Covariance with BTC Has Fallen
The broader crypto market has been weak for a while now, but one accusation that won’t stick is that everything is just moving with Bitcoin.

How Correlated are Digital Assets to Other Markets?
Turns out - not that much! Digital assets generally have a lower correlation to equities (~0.33) than equities do to fixed income (~0.60)!

Prices told one story in 2025. Fundamentals told another.
Tokens had a tough year: the average return for projects that started 2025 in the top 100 (ex memecoins) was -51%, while more than half the tokens declined by more than 72%. Only 8 tokens actually went up.
On the other hand, fundamentals meaningfully improved in most cases.

Alts Dominate Economic Activity, but Lag in Market Cap
If you hold Bitcoin and Ethereum, you probably think you have decent exposure to the Web3 economy. Think again.
Bitcoin and Ethereum remain the dominant digital assets by market cap, representing over 80% of the market cap of the Top 100 tokens. But despite this skew in valuation, Bitcoin and Ethereum don’t necessarily reflect the majority of digital asset activity.

Bitcoin Stumbles - Don’t Panic
The latest bout of market uncertainty briefly brought Bitcoin down about 20% from the highs of the last 90 days. While the move feels extreme, it’s worth remembering how frequently this still happens for Bitcoin, the oldest and most stable of digital assets, even in up-trending markets.

Nuance Comes to ‘Alts Season’
The past few weeks have brought their fair share of volatility, but altcoins have generally performed well over recent months. Whenever this happens, talk inevitably turns to the idea of another “alts season” - a term that has been used to describe broad, indiscriminate rallies across the altcoin market in the past. Many investors still look back to 2021 as the benchmark for such periods. Realistically, though, that kind of market environment isn’t a healthy goal.

Generic Listing Standards for ETFs - How Do Fundamentals Stack Up?
Digital assets just cleared another major milestone: The SEC has approved generic listing standards for ETFs (or specifically, “Commodity-Based Trust Shares”) that explicitly cover certain digital assets. By our count, only ~14 assets currently qualify, and the list is dominated by Layer 1s and currencies, with a few memecoins as well. Notably, these are also some of the more richly valued projects in the market.
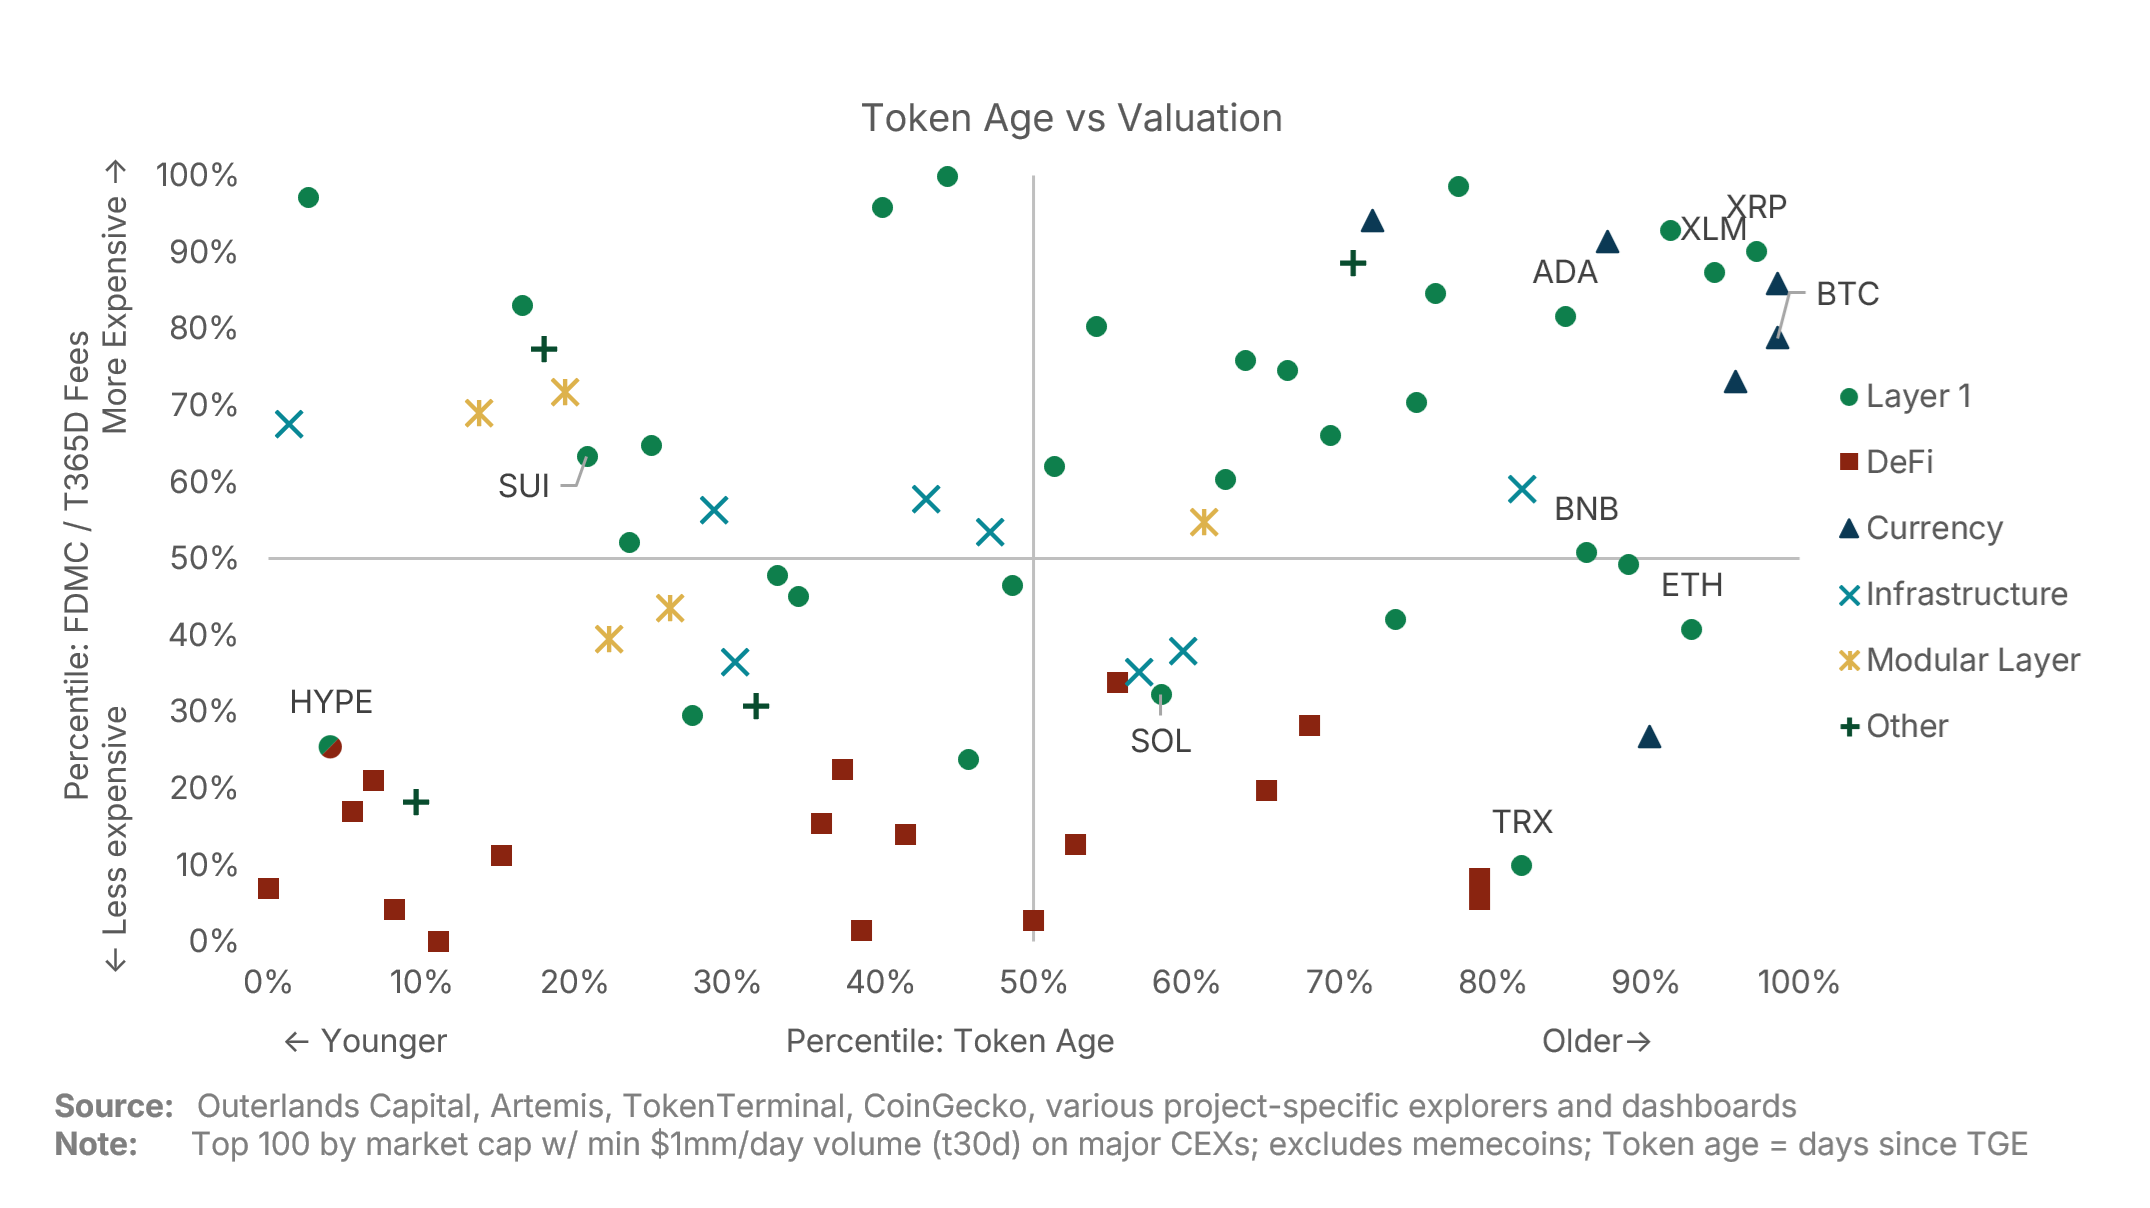
Crypto Relative Value: A Lindy Effect in Crypto?
Continuing on the theme of fee-related valuation, we next take a quick look at valuation compared to age (again using fully diluted market cap to trailing 365 day fees, and using days since the token-generation-event for age). A glance at the largest assets by market cap shows a lot of older token projects: The top 10 have an average age of over 7 years, compared to the rest of the top 100 which has an average age of under 5 years. The question being: are projects getting a valuation boost simply because they’ve been around for a long time? In other words: is there a strong Lindy effect in crypto?
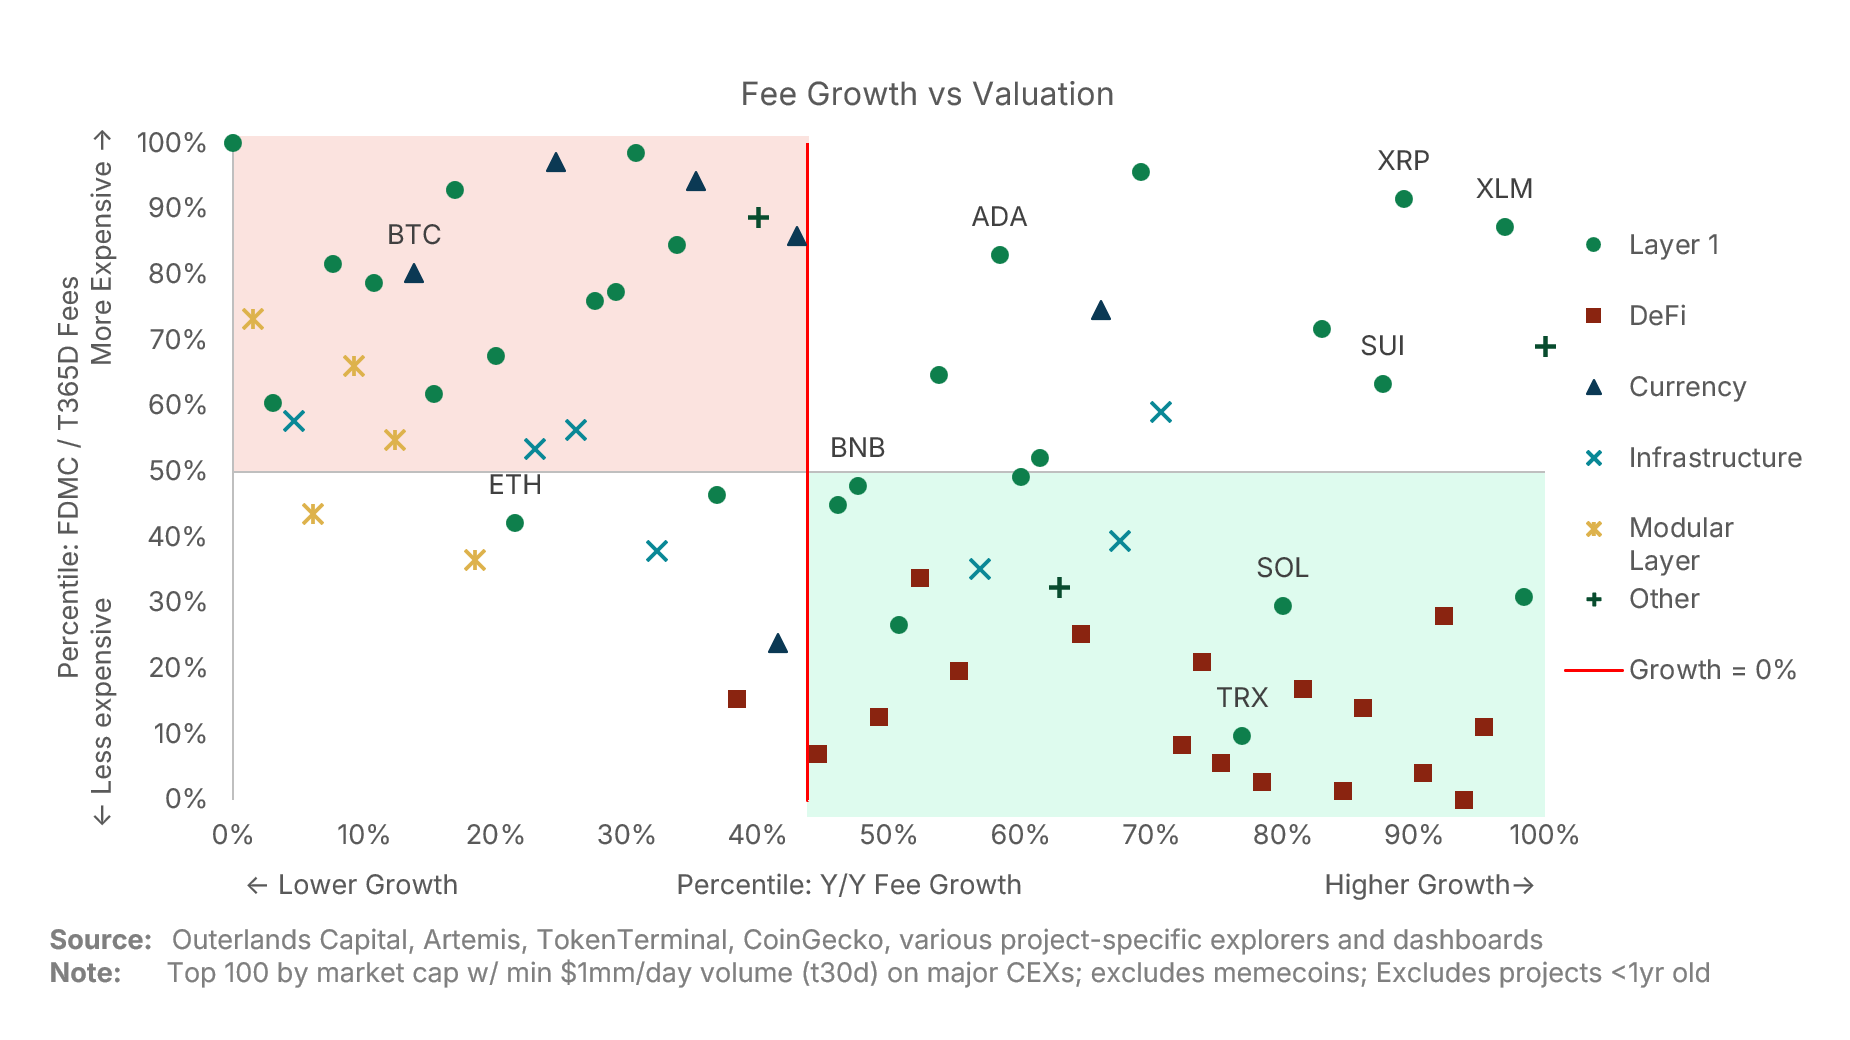
Crypto Relative Value: Adding Growth to the Picture
Last week, we compared top-line fees (transaction costs, fees, interest paid, etc.) to fully diluted market cap and noted the wide range of fee generation across digital assets, the Layer 1 premium, and Bitcoin’s unique position. This week, we add growth to the picture.
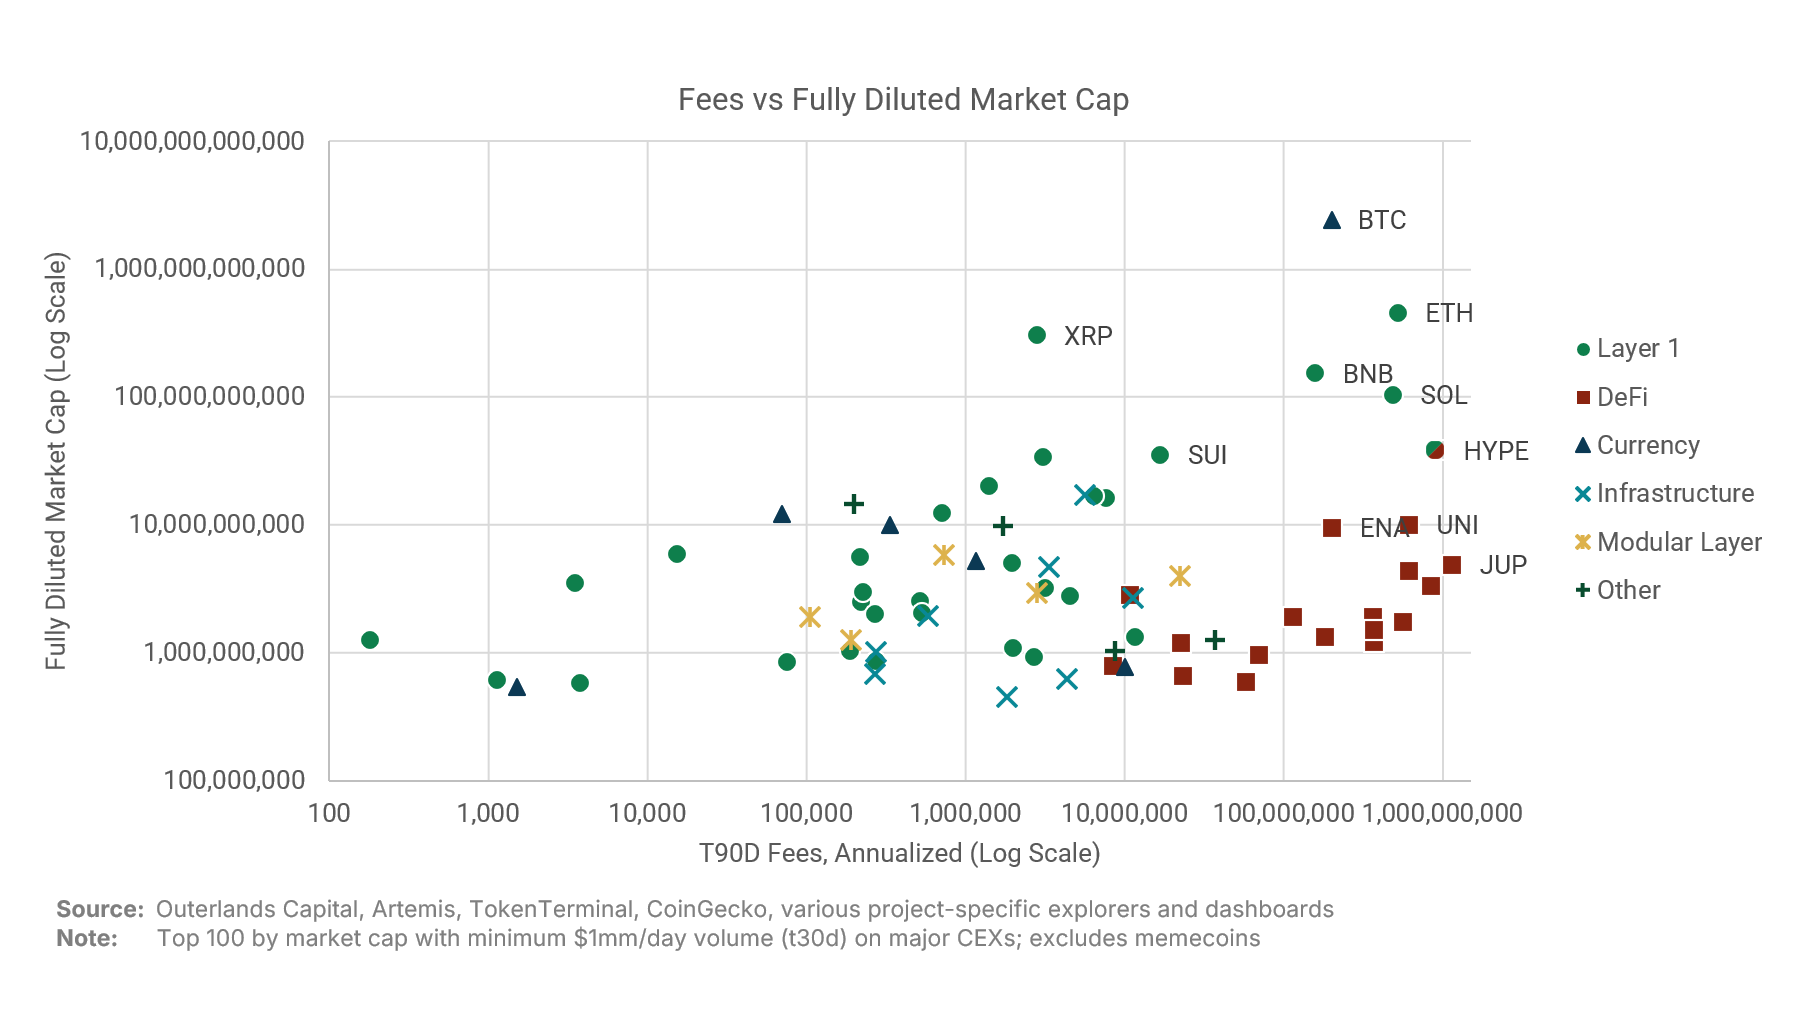
Crypto Relative Value: Fee Generation
There are many ways to assess the value of a token. When we survey the landscape of crypto projects, we try to assess diverse aspects like fee generation, usage, addressable market, growth, and token structures that shape value accrual. Given the highly disparate nature of crypto projects, such exercises can become complex, especially when trying to compare projects, particularly across different sectors.
Sometimes it’s worth taking a step back and viewing the market through a more simplified lens.
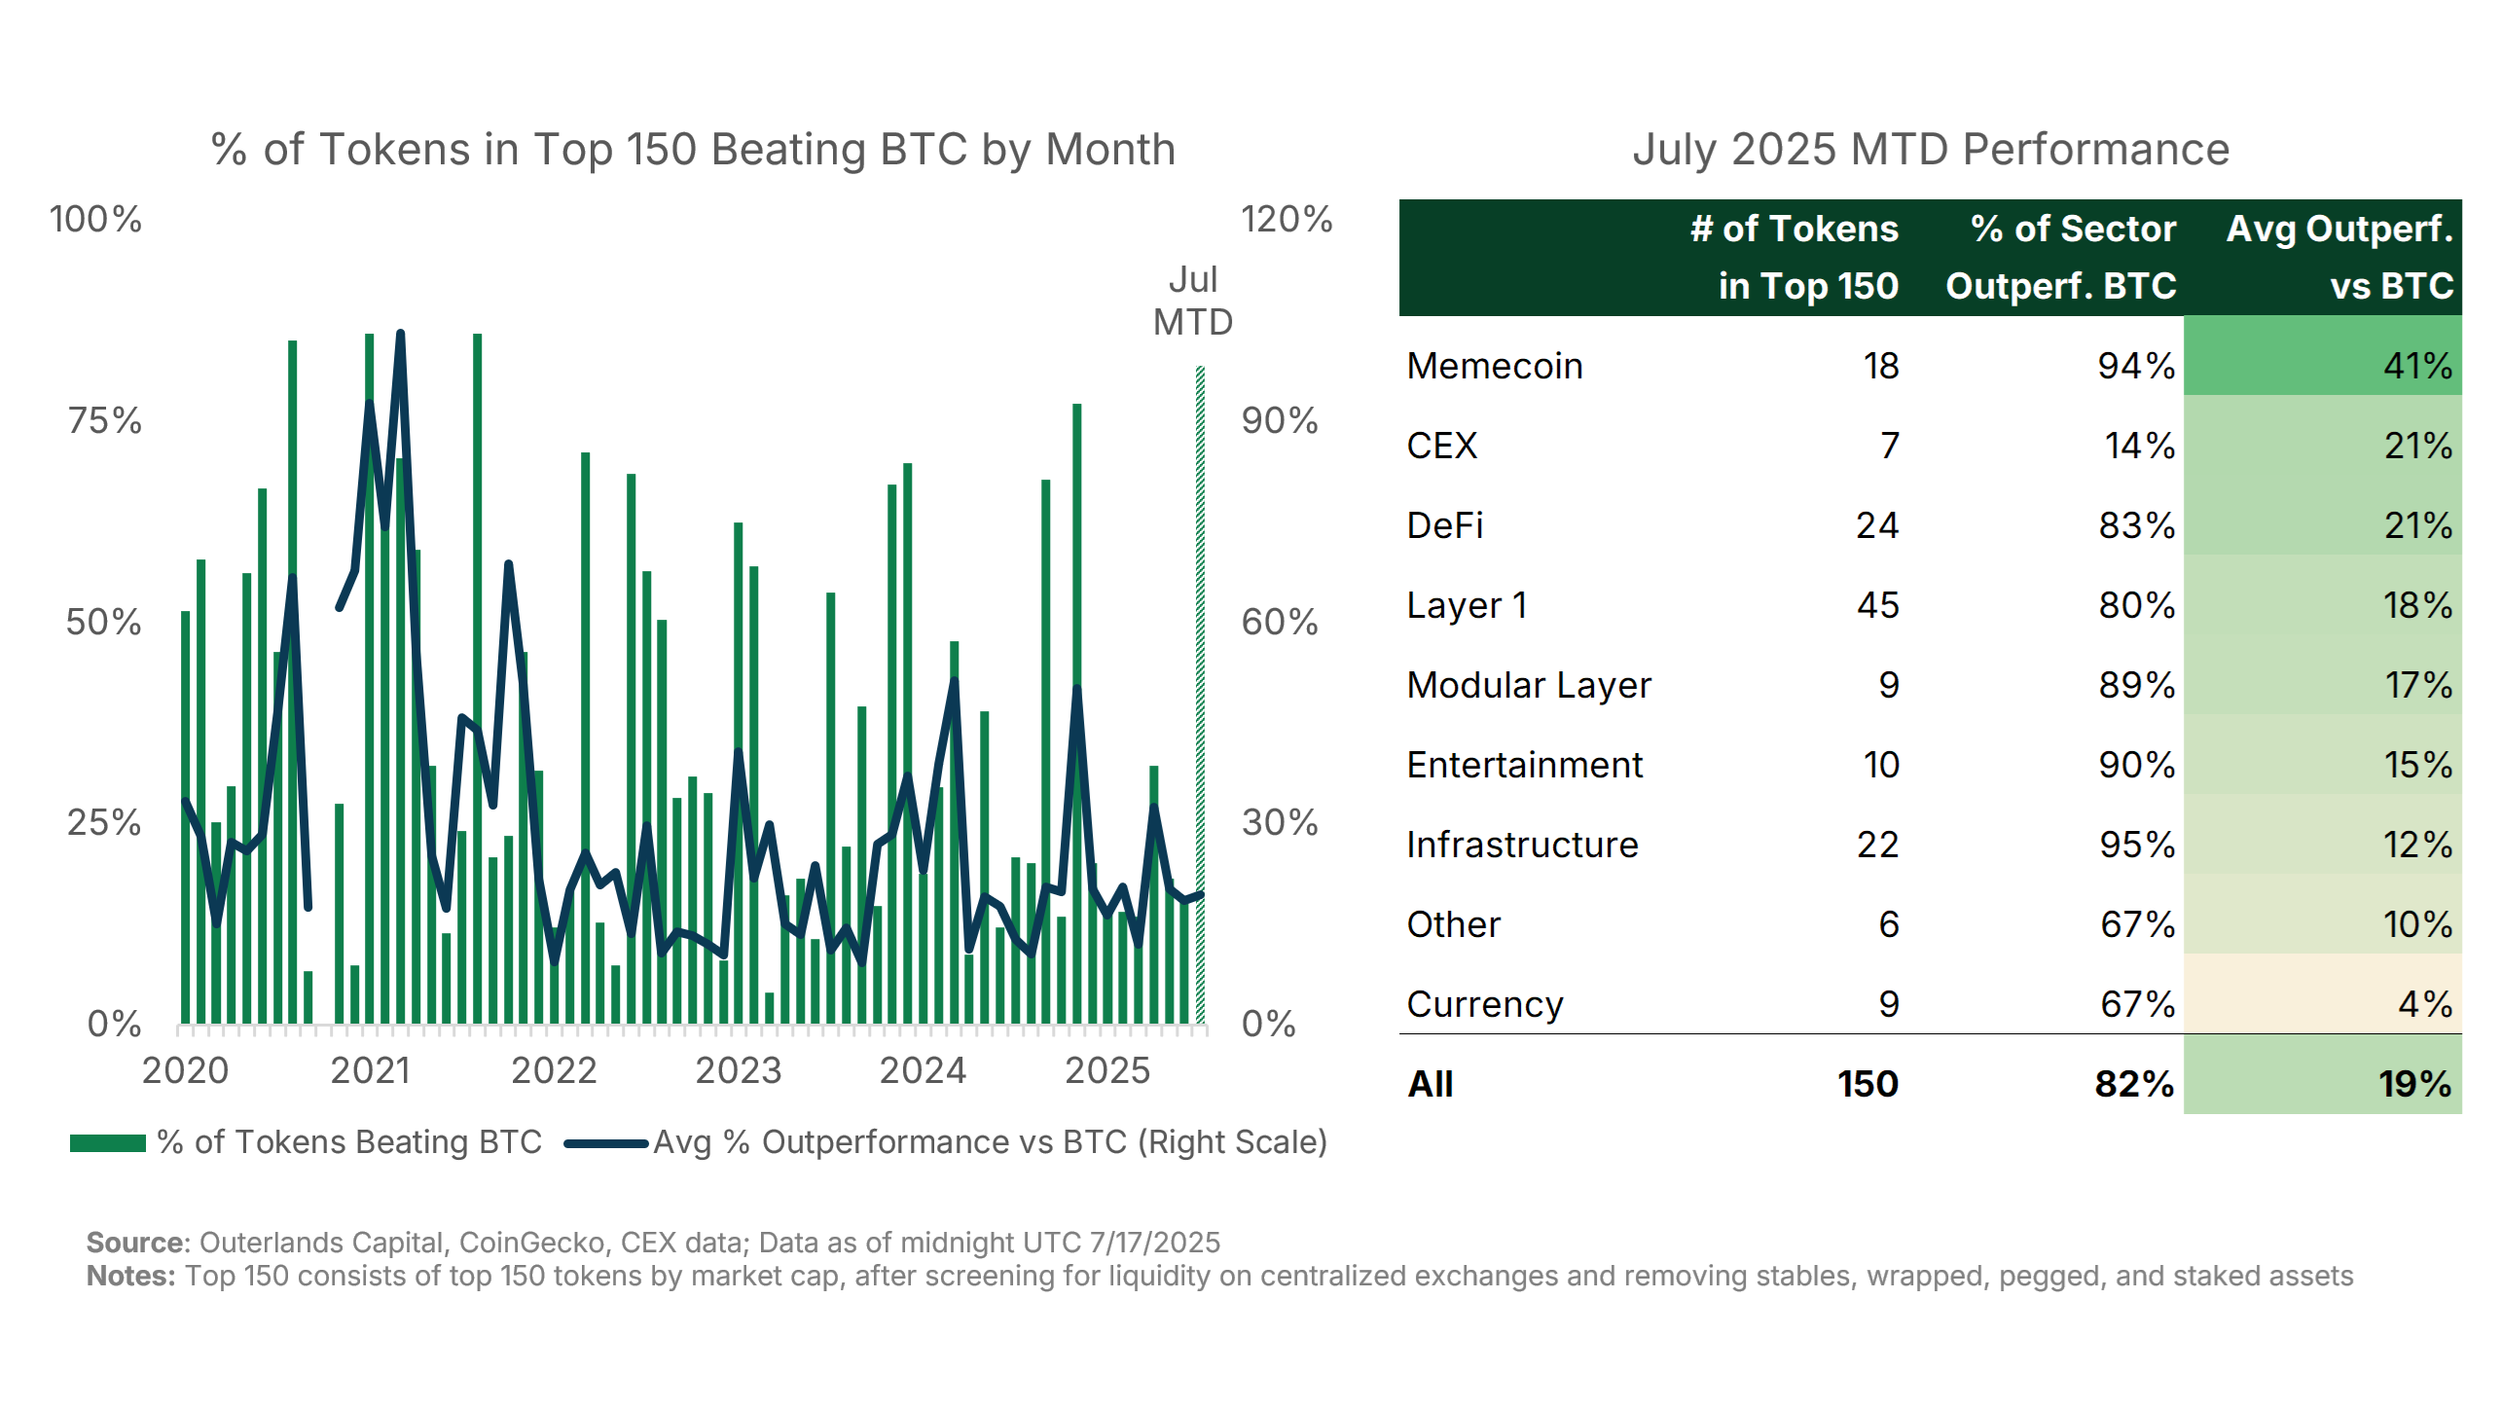
Beating Bitcoin
Bitcoin hit a fresh all-time-high this week, and ‘alts’ are heating up as well. Notably, over 80% of tokens in the Top 150 have outperformed Bitcoin month-to-date, by an average margin of ~19%. As altcoins rally, concerns about having “missed the opportunity” tend to surface. However, on average, these tokens are still trading at just 30% of their prior all-time highs, suggesting substantial potential upside remains. In fact, only a small subset of assets are currently trading within 5% of their historical peak.
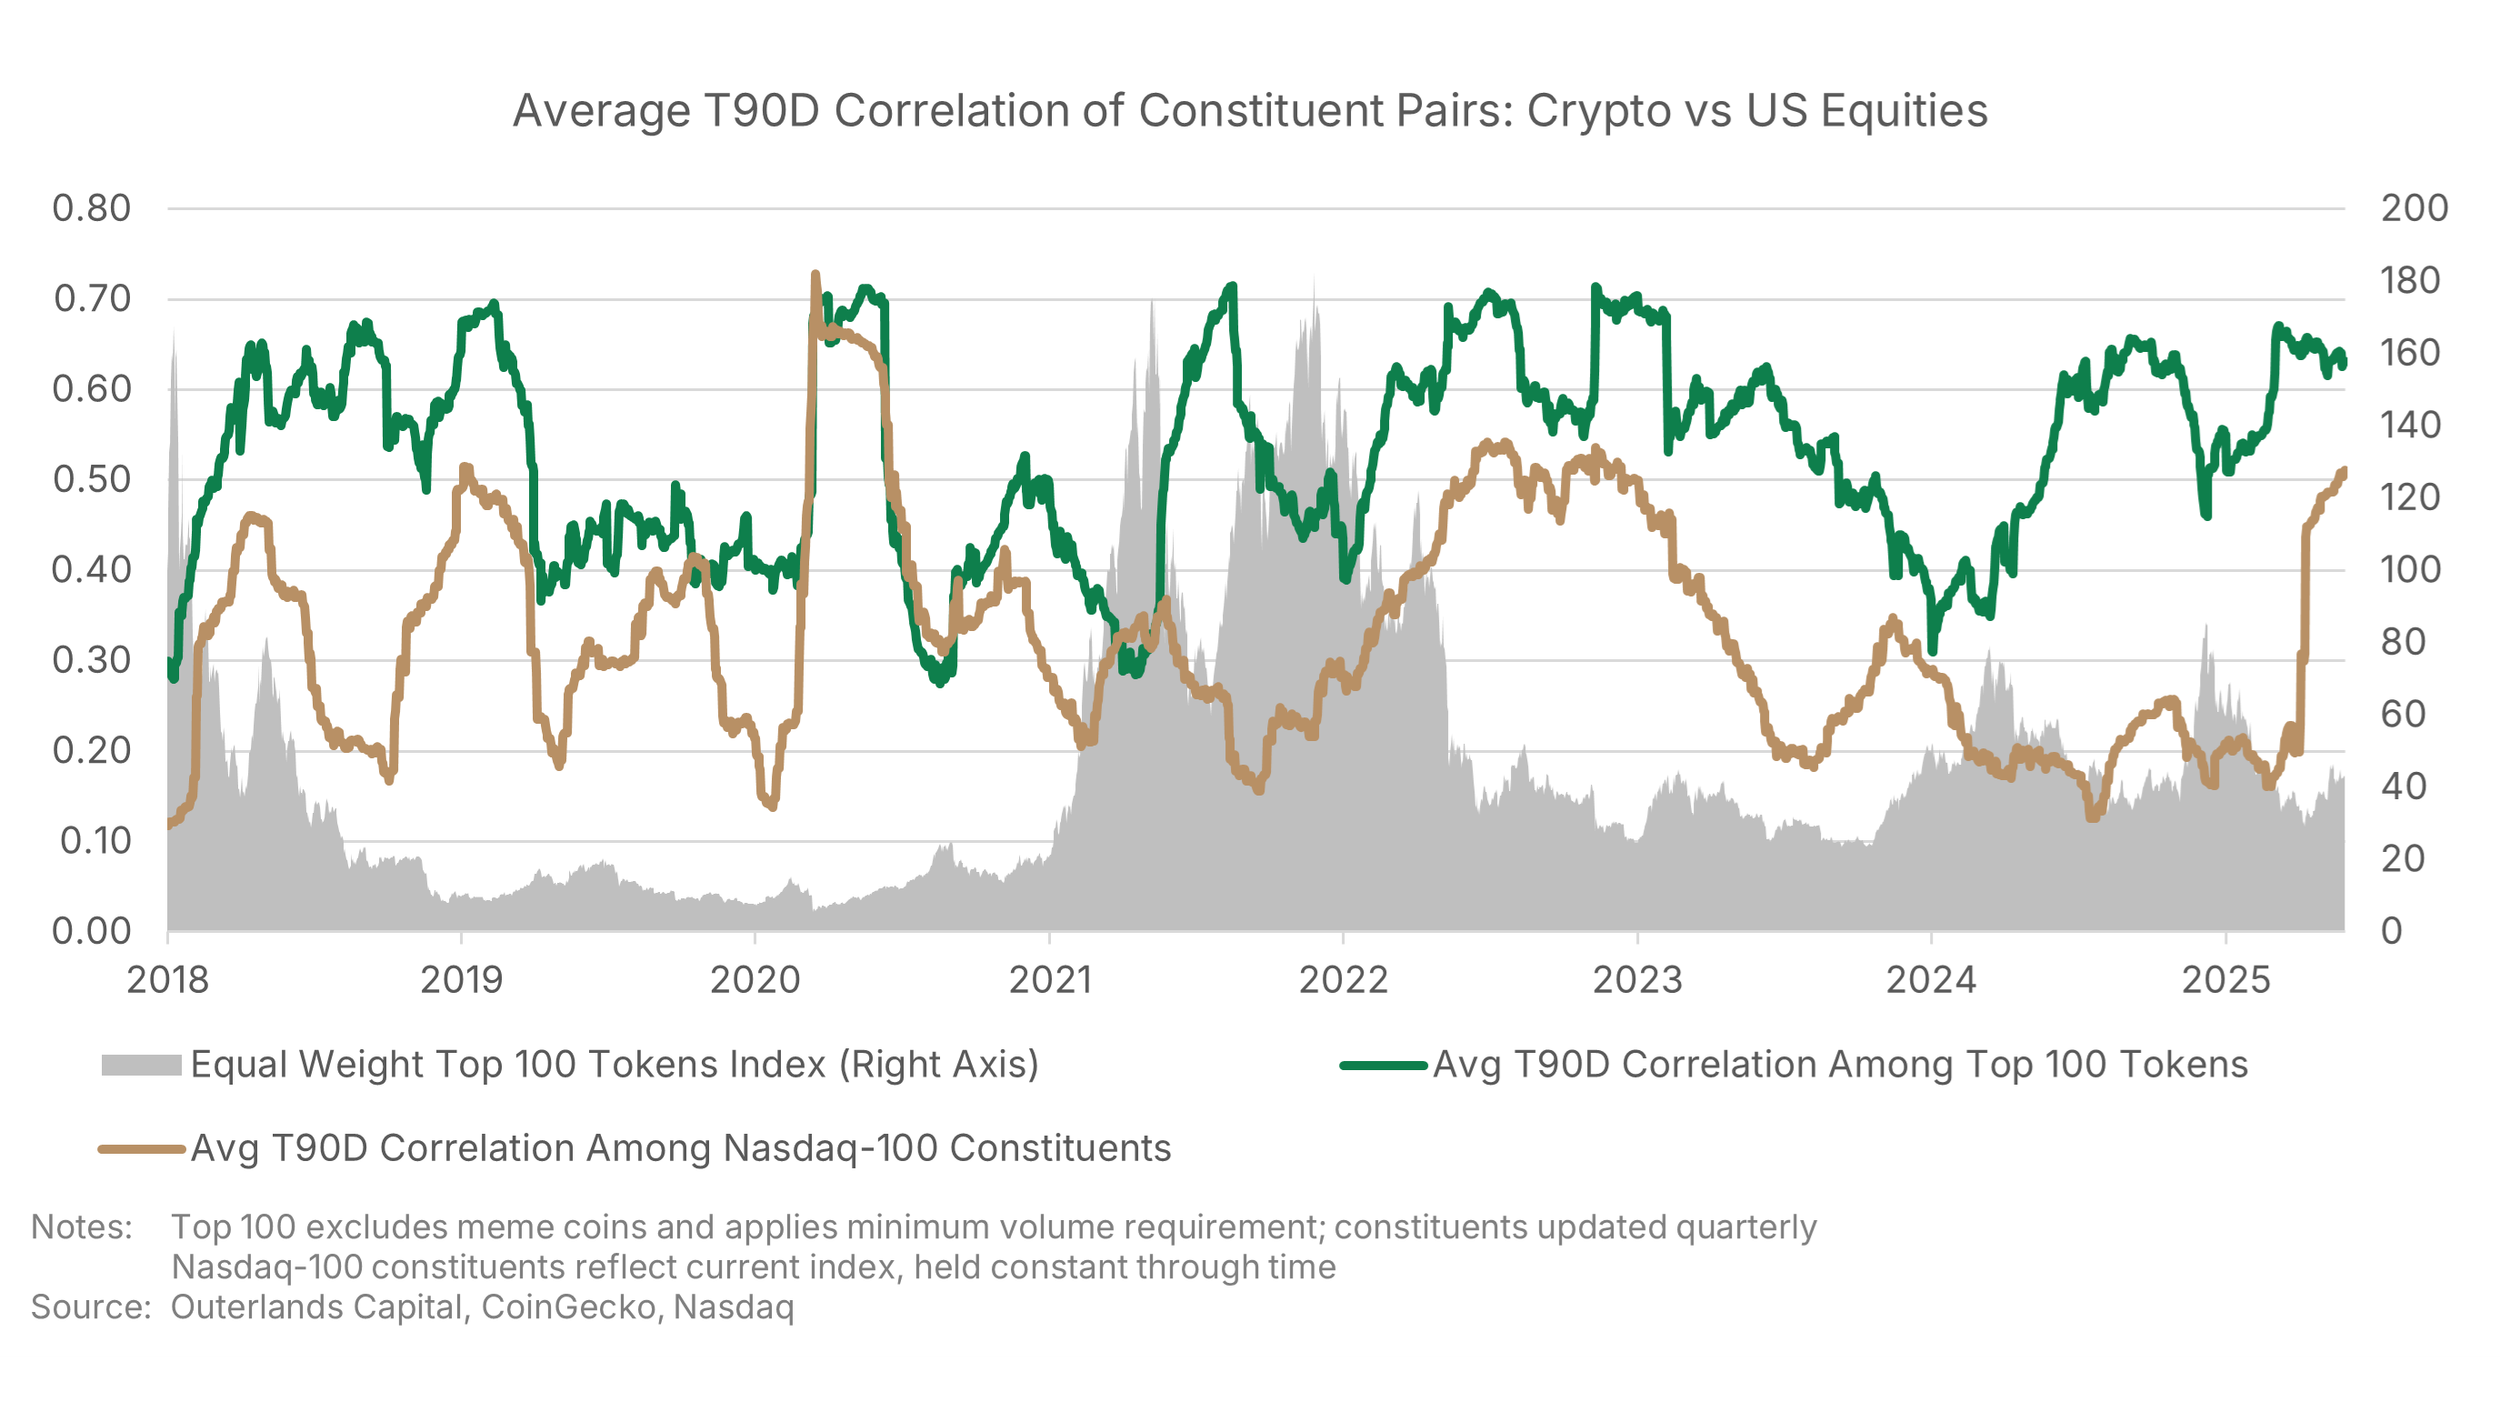
Pairwise Correlation Update
Amid recent market turbulence, we’ve revisited pairwise correlations - comparing the movements of tokens relative to other tokens in the top 100 and doing the same for stocks in the Nasdaq-100 index - and tracking how these relationships evolve. Since our last post on this subject in summer 2024, token correlations initially declined into year-end before rising again alongside Q1 geopolitical shocks.
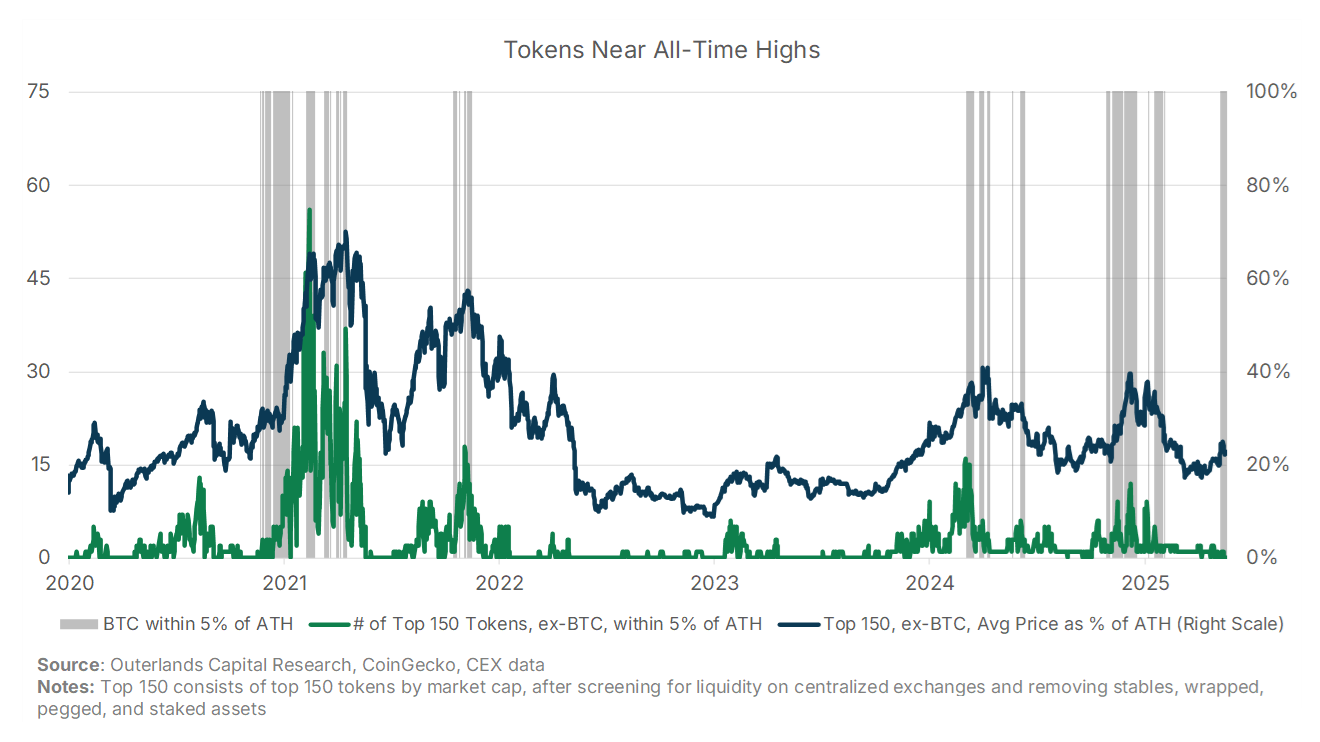
Tokens Near All-Time Highs
Bitcoin is at all-time highs again. But what about the rest of the digital asset space? Looking out at the Top 150 tokens by market cap, only a small handful have approached all-time-highs (ATH) in the last week. Those tokens have since fallen off those highs, leaving BTC the sole token in the Top 150 within 5% of its ATH. For comparison, as recently as the end of 2024, 12 other tokens were within 5% of their ATHs. On average, tokens in the Top 150 after BTC are trading at <23% of their all-time highs.
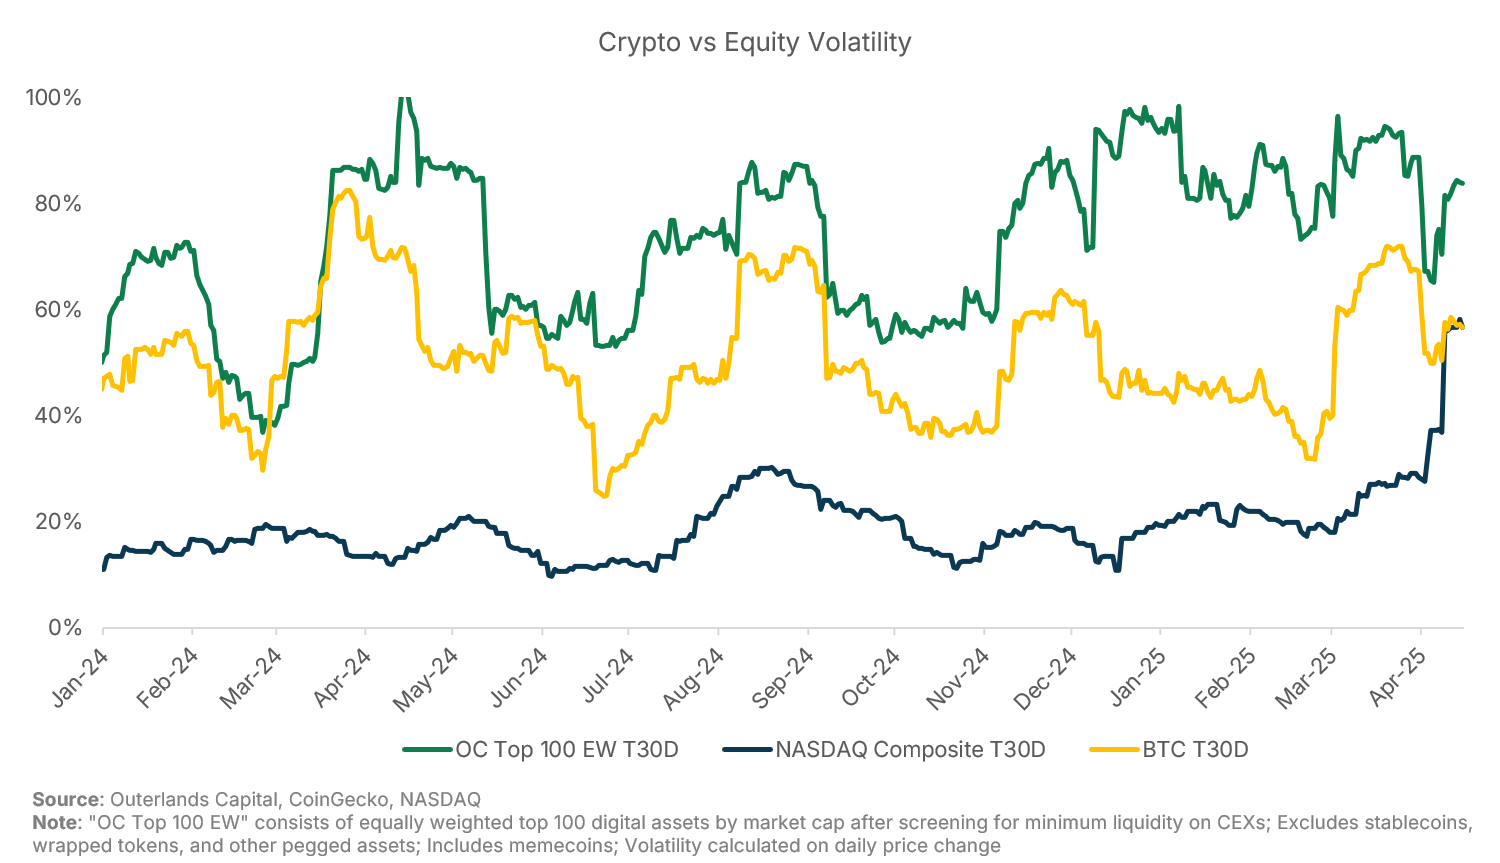
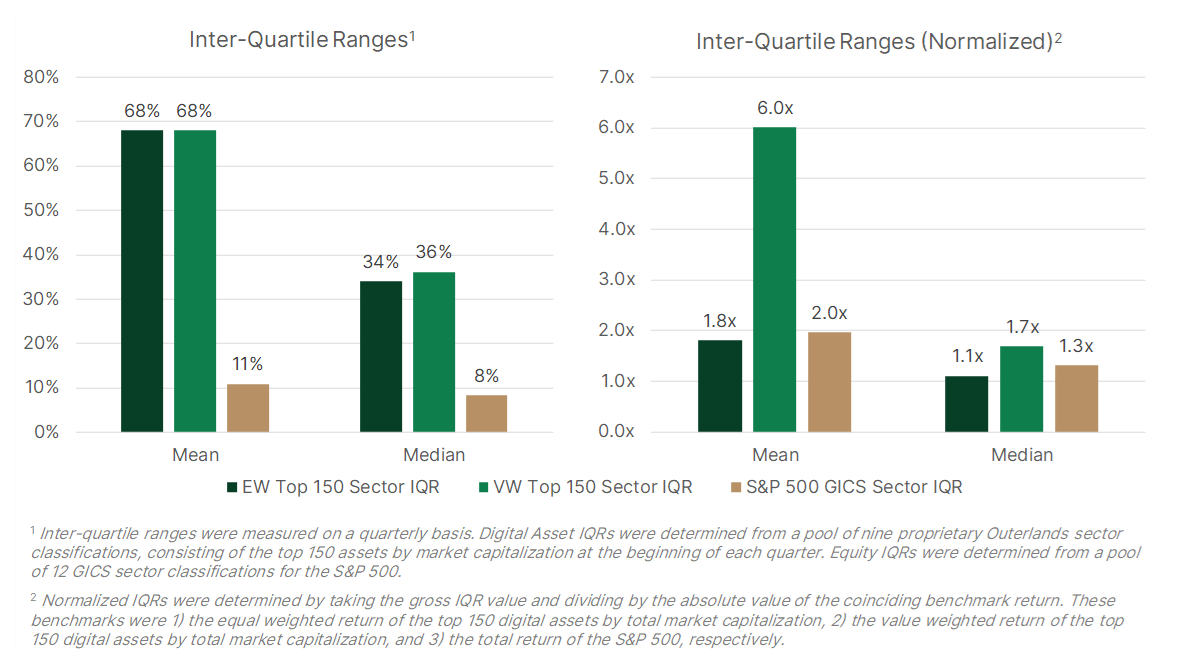
Contextualizing the Vol Move: Crypto vs Equities
The macro environment has sent global markets into turmoil. Assets have notched extreme price moves across markets, but the relative magnitude of these moves vs history has varied– particularly in the comparison between digital assets and US equities.
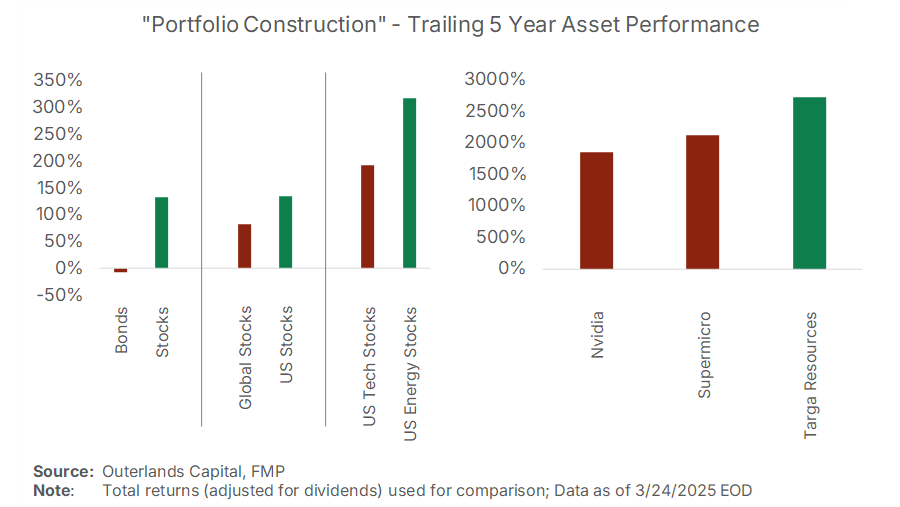
The Single Asset Portfolio: Only in Crypto?
There seems to be a common approach to digital assets that looks at the performance and/or volatility of Bitcoin over the last few years vs other digital assets and concludes that Bitcoin alone makes for a satisfactory digital assets allocation.
In no other portfolio construction ‘process’ does this make sense - why should it in crypto?
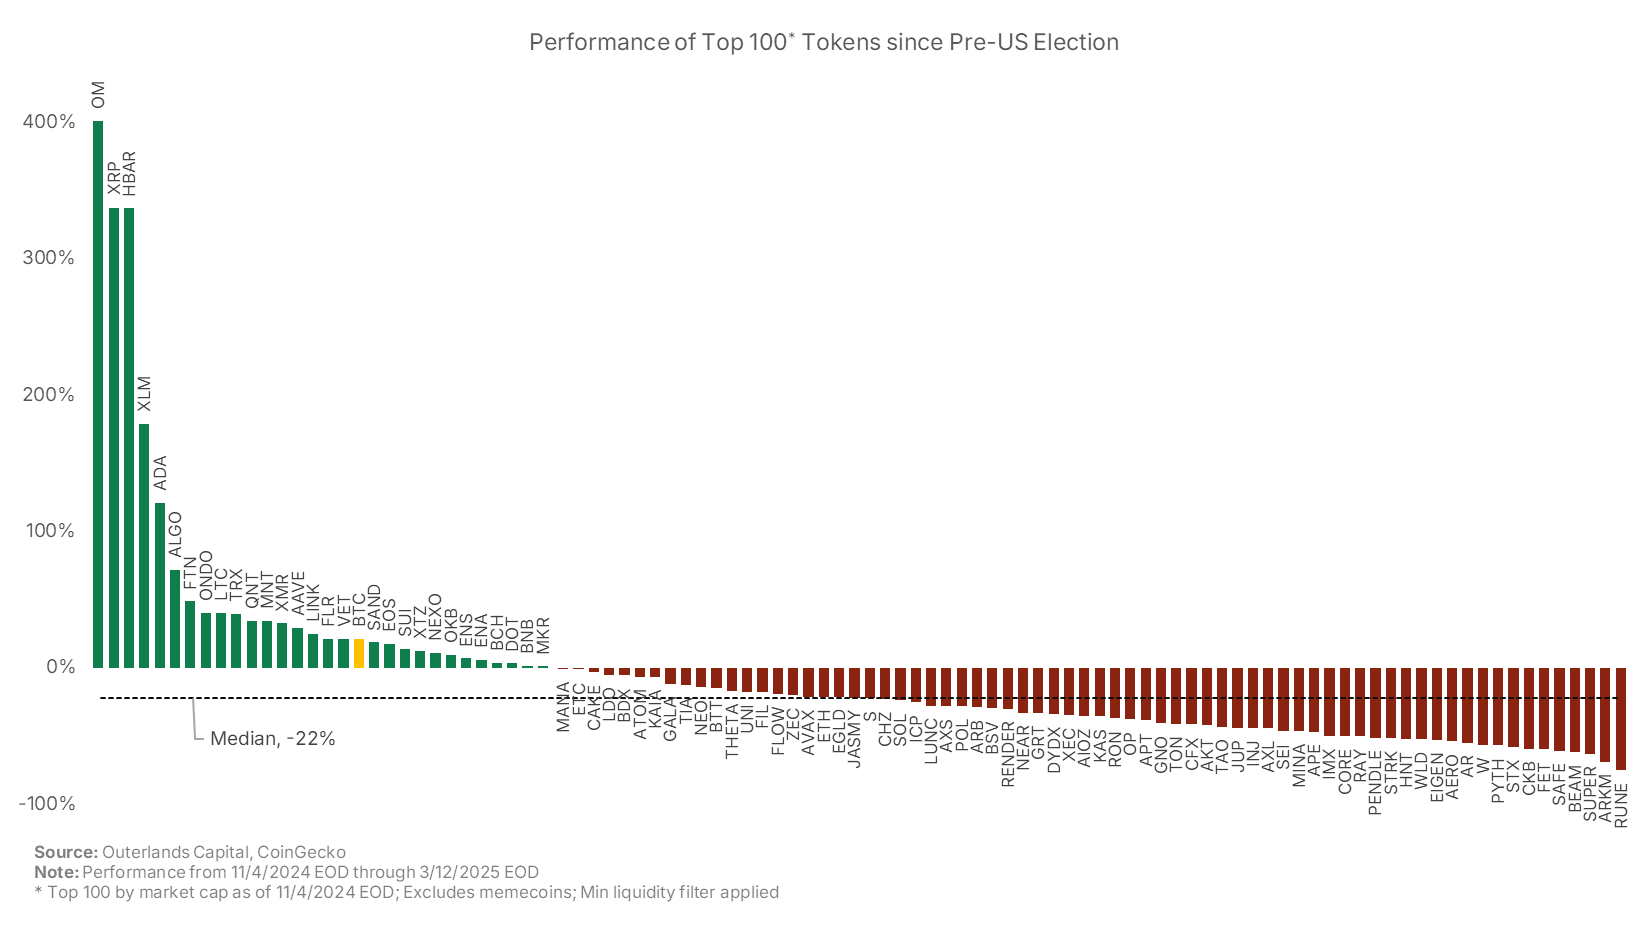
Crypto Performance Since the Election
Four months after the election, only 30% of tokens in the Top 100 at the time of the election are above their pre-election levels. The median token in the group is down 22%.
While some level of re-rating from exuberant post-election levels was inevitable, seeing most of the market down materially vs pre-election levels seems overdone. It’s hard to argue that the fundamental case for crypto now is worse than pre-election. In fact, it’s arguably much better, given the walk-back of many regulatory actions against crypto firms and new government focus on fostering crypto markets in the US.
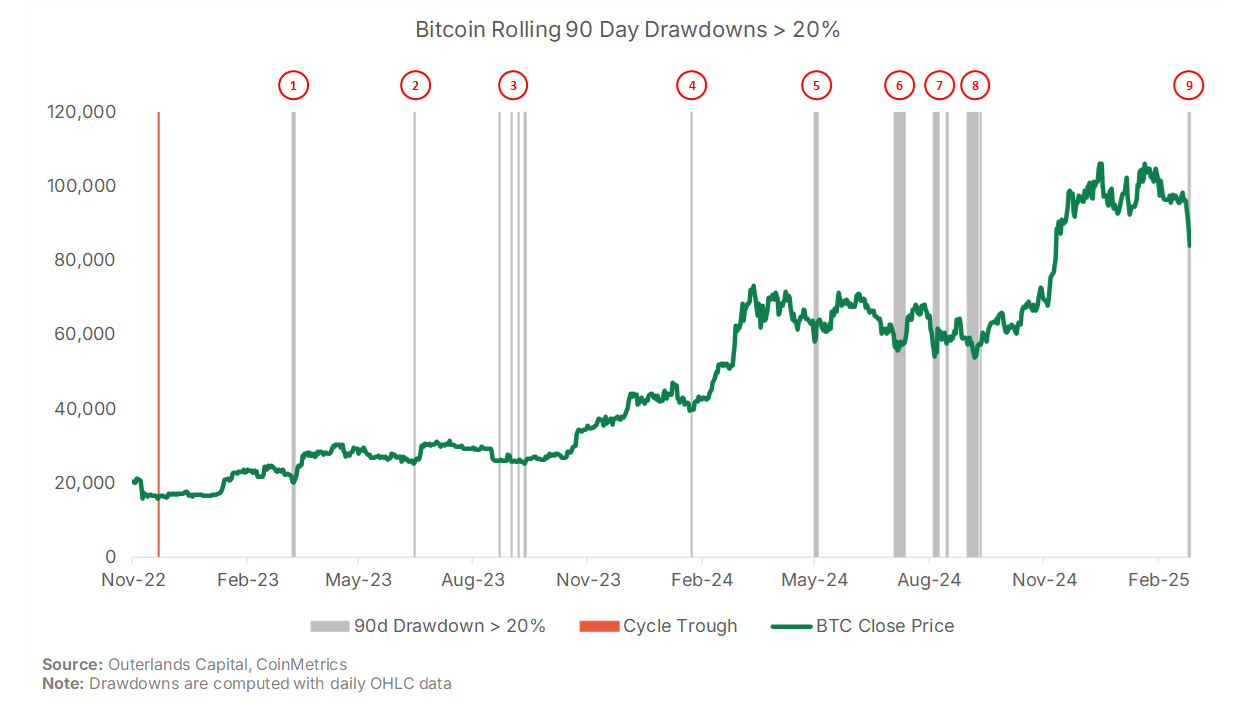
Is the Bull Market Already Over? (We Don’t Think So)
The latest bout of volatility in digital asset markets has commentators questioning if the bull market is over. Although recent moves have been violent, it is not unlike digital assets to experience sharp, painful drawdowns during bull markets. Even looking at Bitcoin, one of the less volatile digital assets, there have been 8 periods where its price has fallen more than 20% in a rolling 90 day period, since the latest up-trend began in November of 2022. The latest drawdown marks the 9th. Meanwhile, Bitcoin is still up over 440% since the trough.
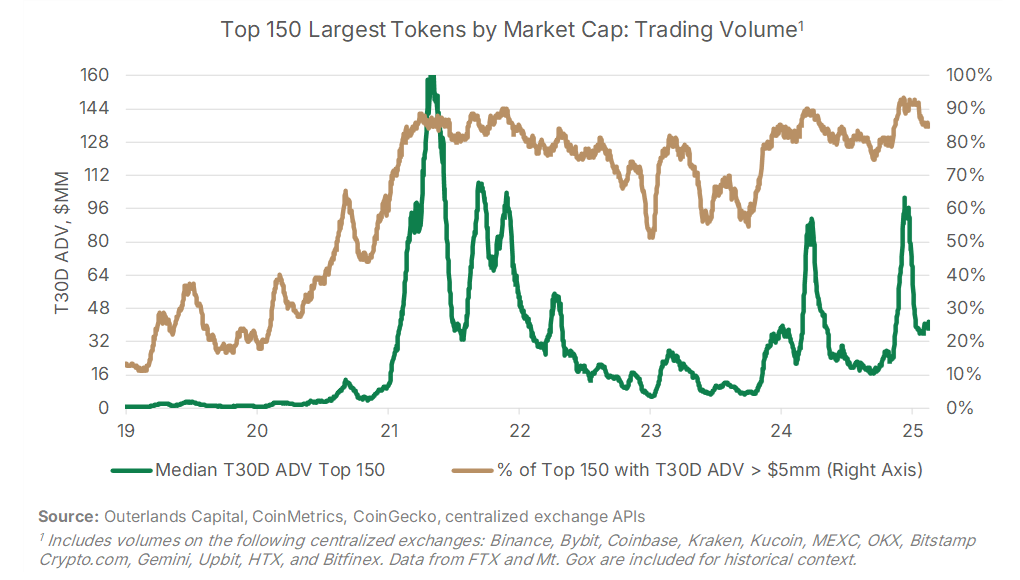
Alts: More Liquid Than You Might Expect
Liquidity can be a concern for investors looking to deploy meaningful capital in digital assets. However, as the market has grown and evolved, liquidity across a broader number of tokens has improved, and should not bar investors from looking further out the spectrum of tokens to gain diversified exposure. Mega-cap assets like Bitcoin, Ethereum, Solana, and Ripple show trading volumes in line with the top 25 most traded US public equities, based on 30 day average daily volume (ADV). However, as we have frequently stressed, investors should consider looking past just the largest names in order to capture exposure to the varied themes and opportunities of digital assets. Here, liquidity has also improved.
Digital Assets: Not a Monolith
There remains a misconception that digital assets are a monolithic asset class, dominated by beta and lacking differentiation. The line of thinking goes: “everything moves together, so why not buy only Bitcoin and be done with it.”
We disagree.
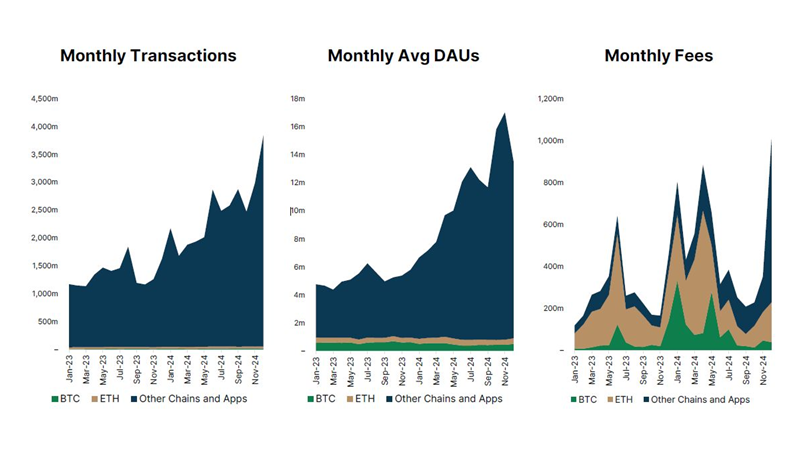
Alts Shine in Fundamentals Composition
Bitcoin and Ethereum are dominant digital assets– they prevail in mindshare, in market cap, and in investors' portfolios. It is easy for crypto investors to disregard the remaining universe of "altcoins", which seem minute in comparison. However, Outerlands Capital believes investors would be remiss to not consider fundamentals before making such a hasty write off, as actual onchain usage tells a very different story.